A FLATTENING YIELD CURVE AND WHAT IT MEANS
By Mark Ukrainskyj in Trusted Advice
As the Federal Reserve has continued to raise overnight interest rates, talk of the flattening yield curve and subsequent recession has been increasing among investors. And with good reason, as seen in the chart below, the U.S. Treasury yield curve has inverted before each of the last six U.S. recessions. Not a bad record for an economic indicator. But what is a flattening yield curve and why is it so apparently bad for the economy?
A yield curve is a graph of a set of interest rates for a debt issuer, or class of debt issuers, spread out over different maturities. In this case it is understood to be that of the U.S. Treasury interest rates, or what the U.S. government pays to borrow for different lengths of time. Given its risk free status, (the U.S. government has never defaulted and in any case can always print more dollars) this is used as the baseline rates for all other borrowers in the U.S.. In general, the Treasury yield curve is upward sloping as longer time frames increase uncertainty and lenders wish to be compensated for that uncertainty. How flat the yield curve is is generally measured by the difference between the 10 year rate and the two year rate. It is inverted when short term rates are higher than long term ones.

Historically, the Fed has raised overnight interest rates (the shortest term) to cool down an overheating economy before inflation can get out of control. By raising those rates, it makes it more expensive for banks to borrow, which should decrease the amount they lend, which should then slow down the economy. As these rate increases take hold and the economy slows investors typically buy longer term Treasuries for safety bringing those rates down and further flattening the yield curve. This keeps a lid on what banks can charge for lending money. With it costing them more to borrow and not being able to charge more for lending, banks get squeezed, further decreasing lending thus further slowing the economy. Since interest rate increases tend to act with a lag, the economy keeps growing after the increases and typically the Fed ends up raising short term rates to the point where they are above long term rates and the yield curve inverts. Historically, at that point lending became unprofitable for banks and a recession and bear market soon followed.
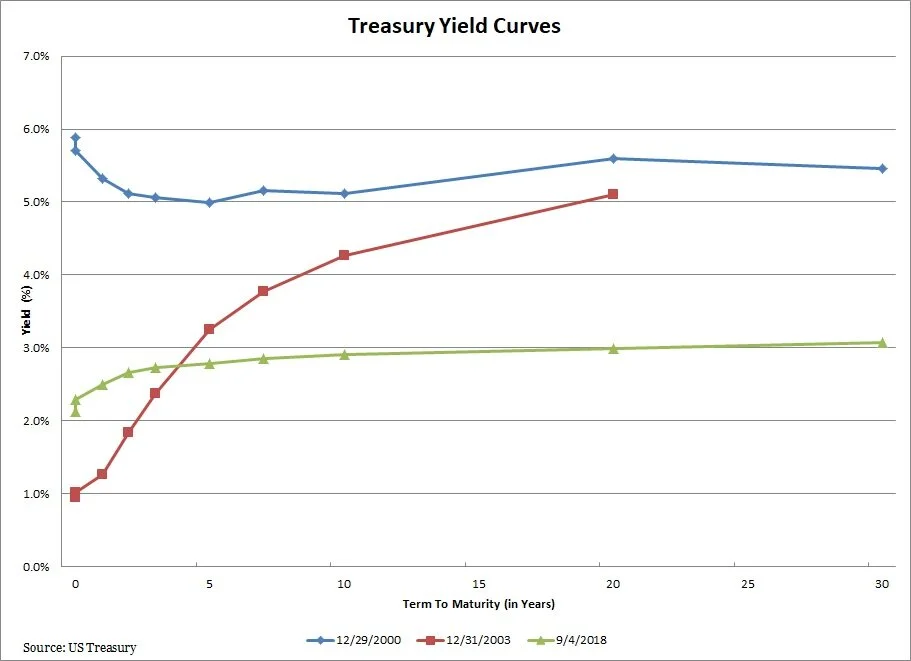
As seen in the chart above, the current yield curve is flat, but not inverted. This is in contrast to the end of 2000, when the short end of the curve was significantly inverted. Not surprisingly, the economy went into recession in the second quarter of 2001. The yield curve from 12/31/2003, when the economy was out of recession, illustrates a normal upward sloping curve. So while we are not quite there, we are a lot closer than many would like. However, at the risk of calling down the wrath of the market gods, could this time be different for some reason?
First off, we need to keep in mind that the flattening yield curve is only one indicator among many in a complex global economy. Other measures such as the Conference Board’s Index of Leading Economic Indicators, which is a blend of ten indicators, including a measure of yield flattening, continue to increase and hit a new high in July. Many other indicators, such as unemployment, purchasing managers indexes, capital expenditures, etc. also point to continued growth.
Second, the 10-2 year spread may not be the best one to look at. Many economists prefer the 10 year to Fed Funds rate spread. Currently the Fed Funds rate is approximately 0.70% points below the two year rate, which indicates that the two year is pricing in almost three more Fed increases of 0.25% each. Even with those three increases, the yield curve would not invert. And some economists point to the spread between the two year and the Fed Funds as the one to watch, because it gets to the crux of credit creation. As long as the two year is above the Fed Funds rate, banks will keep lending to companies. When Fed Funds is higher, it starts being easier to lend money to the U.S. government than to companies and banks tighten lending standards thus leading to recession. Given that the Fed has repeatedly said it is data dependent many doubt that they would intentionally invert the curve without the threat of inflation getting out of control. And with structural factors, such as globalization, technology and aging demographics in the developed world, pushing it down, inflation has stayed relatively calm and in the range the Fed has said is acceptable.
At the longer end of the yield curve, since the Fed started tightening in earnest at the end of 2016, U.S. ten year rates have not moved up as much as those at the short end. A general rule of thumb is that the U.S. ten year Treasury yield should equal the nominal U.S. GDP growth rate. In the second quarter of 2018, nominal U.S. GDP was up 7.4%, with a one year trailing average of 5.4%. If the ten year Treasury was there, there would be no talk of flattening and recession. However, except for a brief period in April and May, the 10 year U.S. Treasury rate has stayed below 3%. Some of the reason for this may lie with other major central banks like the European Central Bank (ECB) and the Bank of Japan (BoJ). They are still engaged in quantitative easing and artificially keeping their interest rates low across the entire yield curve. For example, recently the German 10 year paid 0.35% and the Japanese 10 year clocked in at a whopping 0.099%, averaging out to 0.22%. Average that with the U.S. nominal GDP growth of 5.4% and you get 2.81%, which was very close to the U.S. 10 year yield of 2.82%. With an intertwined global economy and financial markets, it is now easier than ever for money to flow wherever it needs to for the best returns. With their own yield artificially suppressed, it makes sense for European and Japanese investors to go abroad in search of higher returns, thus keeping a lid on longer term U.S. rates and distorting the predictive powers of the yield curve.
From an operational point of view, banks have many tools at their disposal to mitigate the effects of a flattening or even inverted yield curve. Today, much of a bank’s loan portfolio is based on shorter term or floating rates, such Treasury Bills or LIBOR. This enables them to simply earn an essentially fixed spread on the difference between what they pay depositors and earn from borrowers. For the rest of the portfolio, they can easily borrow at lower long term rates and hedge their interest rate exposure. Or they can swap their fixed rate obligations for floating rate ones if that is preferable. Given these options, loan growth would not shrink because of banks unwillingness to lend, but only from a decrease in demand as projects become unprofitable due to higher rates, which could happen whether the yield curve was inverted or not.
All of this does not mean that we are throwing caution to the wind ignoring the flattening yield curve. It has been a good indicator for many years and much of the logic behind why it should work holds. However, in this new age of global quantitative easing, its predictive power may be affected. That is why in managing our clients’ portfolios, we at Covenant are monitoring not only the yield curve, but also a wide range of indicators. If you have any questions, feel free to reach out to your Covenant advisor.