THE CHINA SYNDROME
By Mark Ukrainskyj in Trusted Advice
After a multi-year period of relative calm, markets around the world have been much more volatile this month. While there are many factors behind the change, the most immediate and commented upon factor has been Chinese economic weakness and the devaluation of the Chinese yuan on August 11th by 2%. Chinese growth over the last several years has provided a large portion of global growth and fears that it would drop into a recession and take the world with it swept around global markets.
Though the Chinese economy is the second largest in the world at over US $10 trillion, its direct effect on the United States is much smaller. US exports to China run at an annualized rate of US $111 billion and US imports run at a $553 billion rate. These equal 0.62% and 3.1% of the US’s $17.9 Trillion in Gross Domestic Product. If anything, with US imports from China being so much larger than our exports, a drop in the yuan’s value actually makes life better for US consumers by keeping prices lower on products imported from China.

Chinese Exports: National Bureau of Statistics of China
While China’s trade with the US is relatively small, its exports to the world are a large portion of its economy and its growth. Japan and the European Union (particularly Germany) are also large exporters to the rest of the world. Therefore, the continued decline in value of the Japanese and European currencies, made Chinese exports more expensive in comparison. This made China less competitive on the world stage and slowed their economic growth. On August 11th, shortly after disappointing export figures were announced, Chinese officials lowered the value of the yuan by 2%. This served the dual purpose of making Chinese goods somewhat cheaper in foreign markets and provided a warning to Japan and Europe to keep their currencies from dropping further in value. (See Currency charts at end).
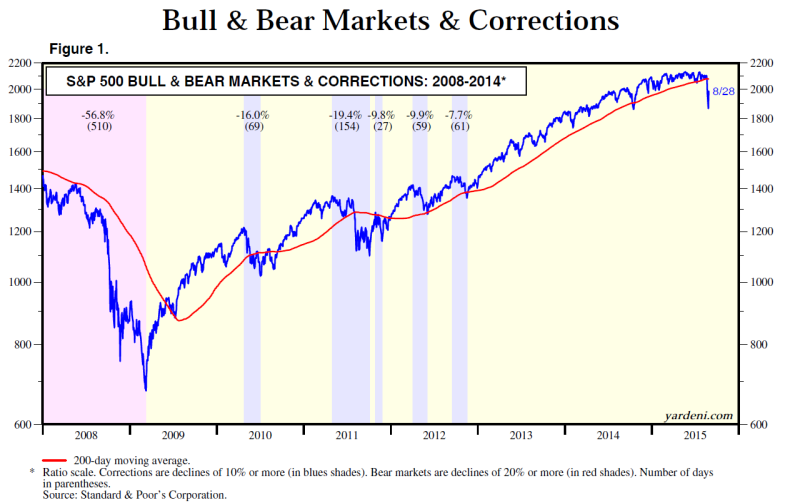
Although China is the most cited reason for the recent market turbulence, it is in some ways the straw that broke the camel’s back. The last time the US stock market ‘corrected’ by roughly 10% or more was in the spring of 2012, or nearly 3 1/2 years ago (See chart above courtesy of Dr. Ed’s Blog). This is much longer than the typical 18 month period between stock market corrections. Also, internal market indicators have been deteriorating for a while as fewer and fewer stocks were leading the market advance. This was due to a combination of lower oil prices collapsing energy stock earnings and a stronger dollar dragging down earnings growth at large multinational companies. We discussed these and other signs that the chances of a market pullback were increasing in some of our recent quarterly outlooks (available here).
The biggest impact that China and the market turbulence may have is on the timing of the Federal Reserve’s planned interest rate increases. Previously, the markets believed that the Fed would start raising overnight interest rates from zero starting at their meeting on September 16-17th. The recent turmoil may give the Fed a reason to delay, but US economic growth is likely the larger driver in its decision making process. Should US GDP growth continue at its expected pace of 2.7% -2.8% in the second half of 2015, a hike in overnight rates sometime this year seems likely.
In sum, while the recent market turmoil has been disconcerting to many, we see it as the first serious market correction in over three years. With strong GDP and employment figures, we do not see it as a signal that a recession is looming, or a bear market is starting any time soon. Instead, we see it as an overdue normal and healthy resetting of expectations in a long term market uptrend.


Currency charts courtesy of XE.com